Avoiding Cone-frontation: Hurricane Watch Weekly Column for October 19th
The Atlantic is mercifully quiet while debate about the NHC's "cone of uncertainty" rages.
WeatherTiger’s Hurricane Watch is a reader-supported publication. Paid subscribers get Florida-focused tropical briefings each weekday, plus weekly columns, full coverage of every hurricane threat, our exclusive real-time seasonal forecast model, and the ability to comment and ask questions for $49.99 per year.
I’m going to start today’s hurricane column with 22 sweet words straight from the National Hurricane Center.
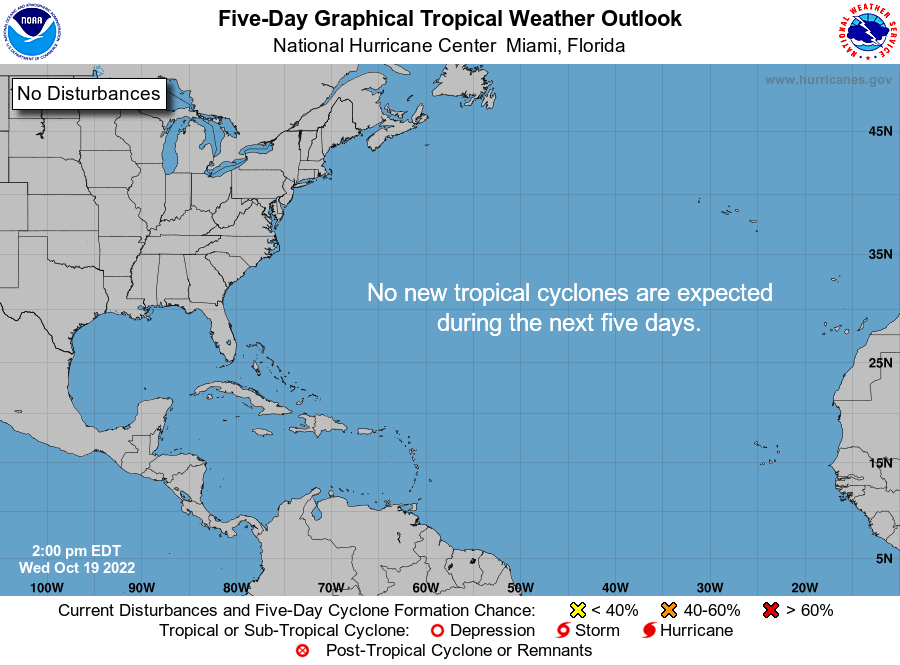
“For the North Atlantic, Caribbean Sea, and the Gulf of Mexico, tropical cyclone formation is not expected during the next 5 days.”
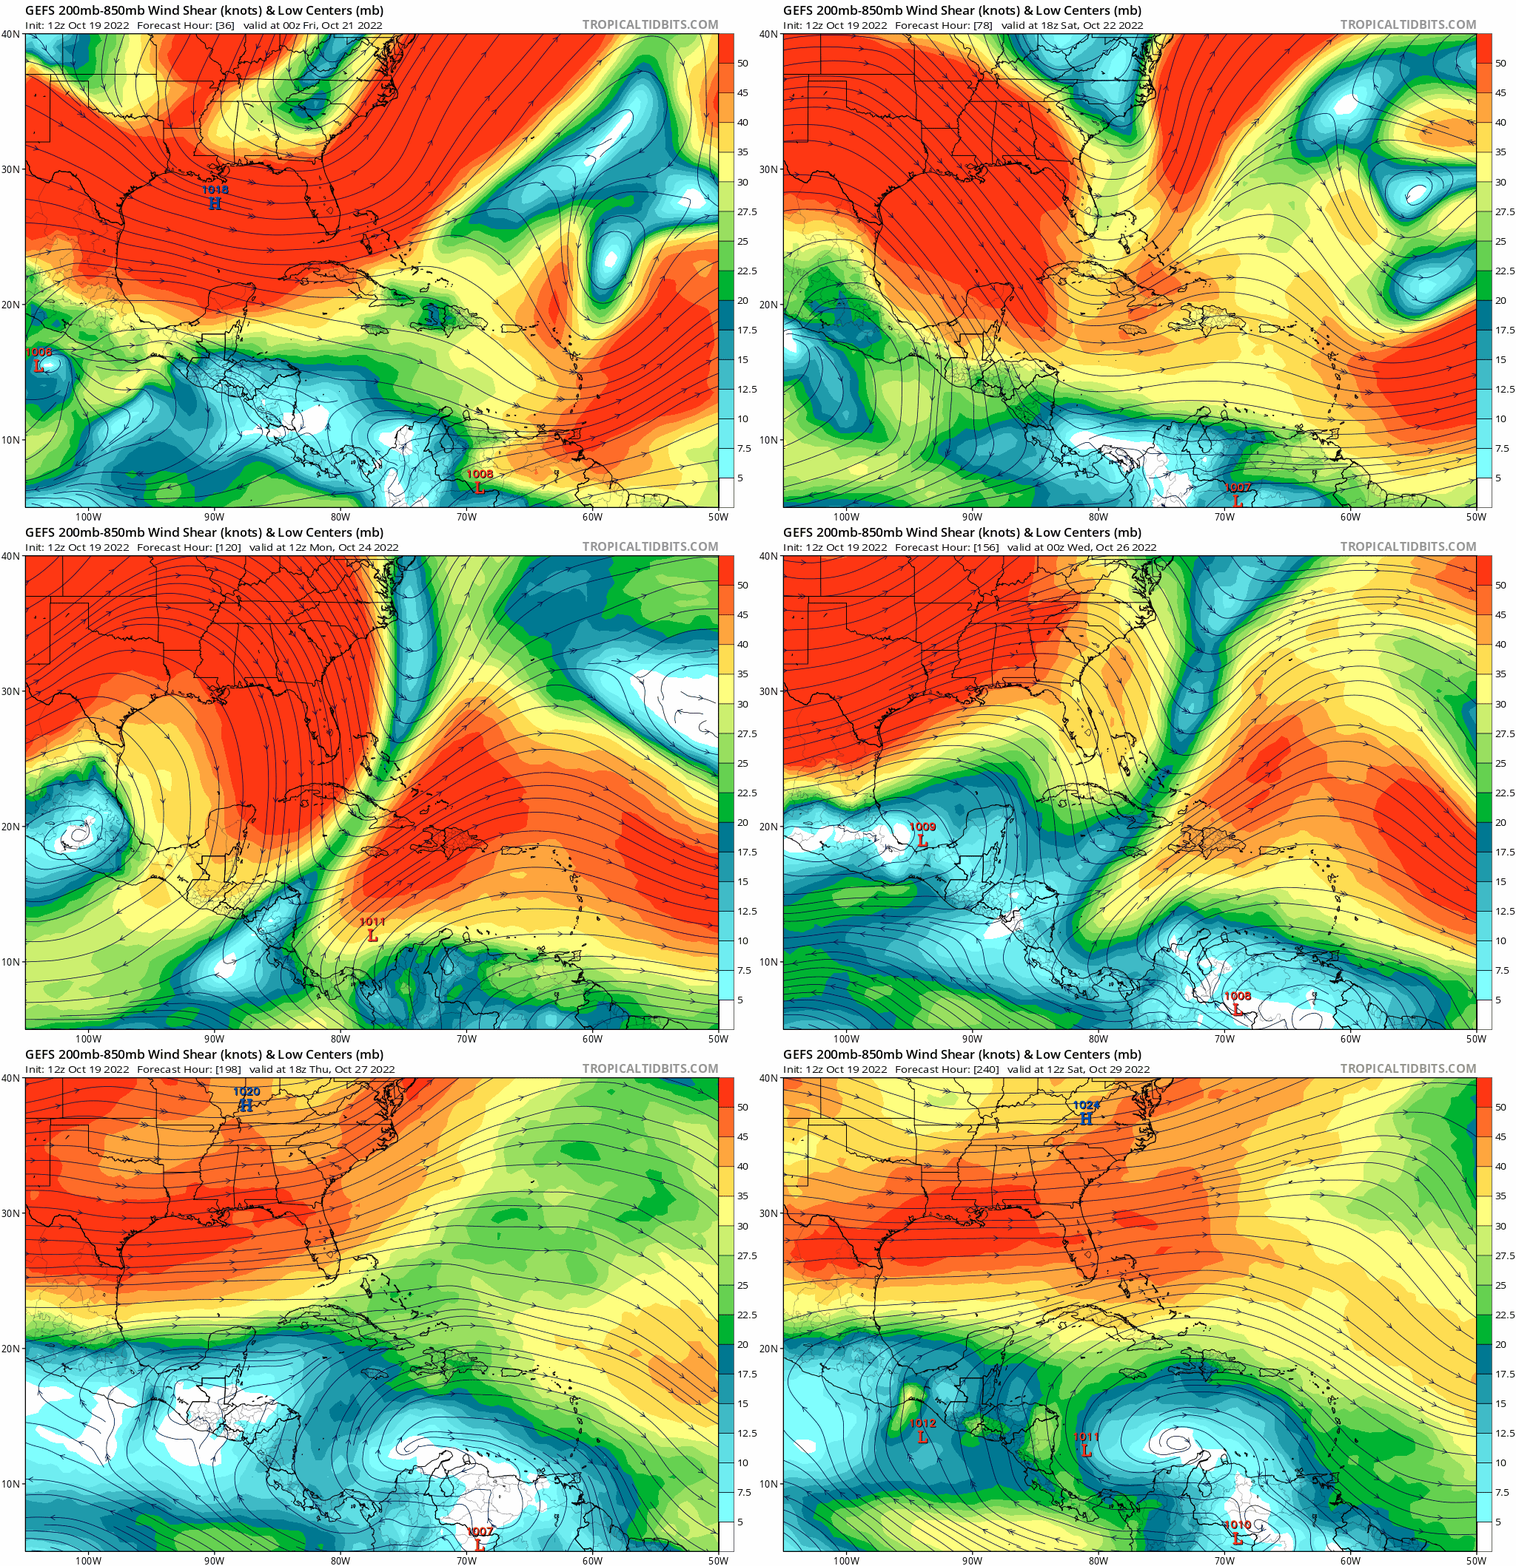
I’ll do storm-traumatized Floridians one better. No tropical activity of the slightest concern to the continental U.S. is in the forecast over the next seven to ten days; the only modest chance of tropical or subtropical development this week will be east of Bermuda, with anything that forms turning harmlessly north into the open Atlantic. Strong wind shear is scouring the Gulf and Caribbean where tropical development is most common in the latter half of October, though the environment there looks to turn a bit more hospitable towards month’s end.
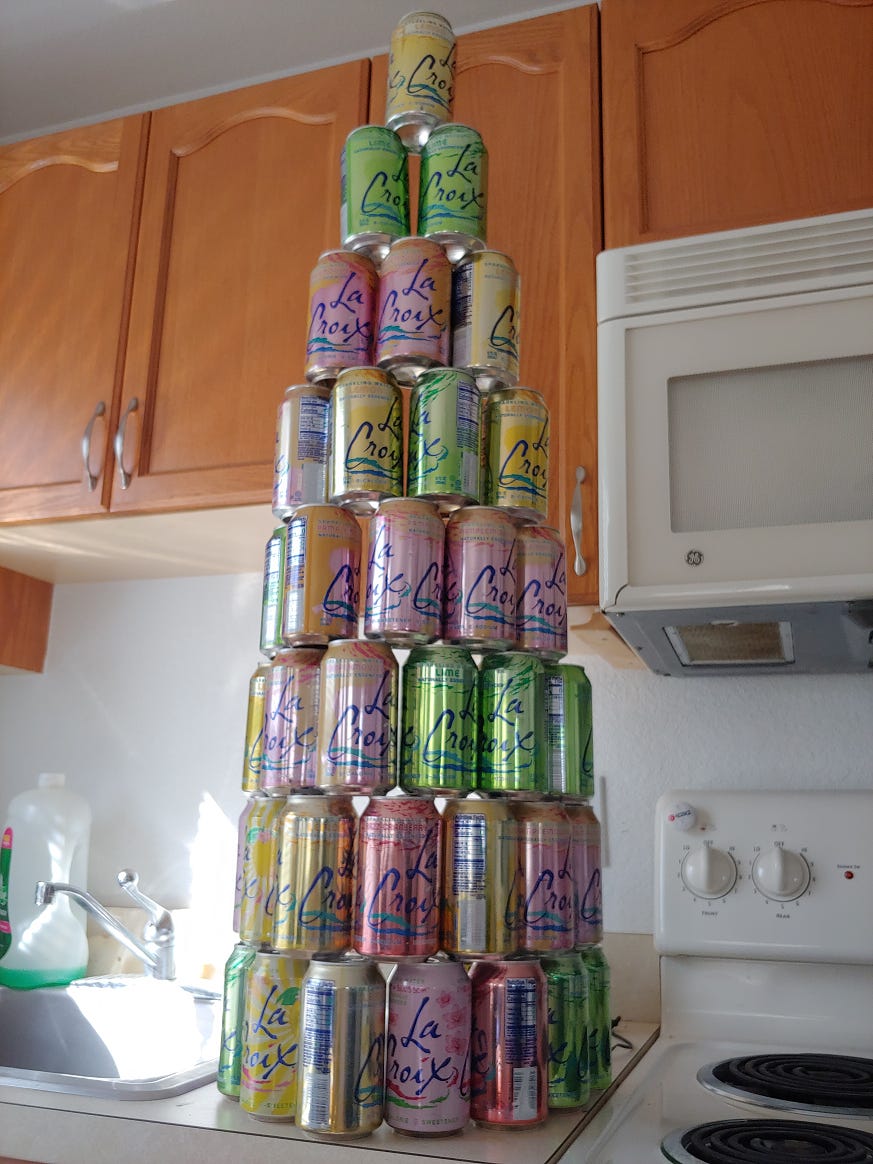
Still, less than 10% of historical U.S. landfall activity remains ahead, with under 2% occurring in November. While hurricane season is not over, it is more likely than not that Ian was the furious finale for U.S. tropical activity. With any luck, WeatherTiger’s office LaCroix can pyramid will close out 2022 at an even 8 levels, and next week’s column will be the final regularly scheduled one of the year.
To celebrate, I’m inviting you, dear Weather Fan, to e-mail me your burning Hurricane Ian-related questions. I’ll answer some pithy queries here next week.
One subject that I’m going to pre-address today is the recent discussion around the NHC’s tropical cyclone track forecast cone, better known as the “cone of uncertainty,” a discussion which I will not call a cone-versation, cone-troversy, cone-undrum, or source of cone-siderable cone-fusion. During Ian, the ubiquitous cone graphics gave some in Southwest Florida the false impression that the area was no longer at risk when Ian’s track temporarily shifted west around three days before landfall.
The cone was introduced in 2002 to counter excessive focus on the “skinny black line,” the NHC’s forecast for the most likely track of the center of circulation. The idea behind the cone was to convey a general sense of the uncertainty of the track projection, as determined by the average errors over the last five years’ worth of NHC forecasts, and thus give the public a better sense of the region through which a storm would probably track.
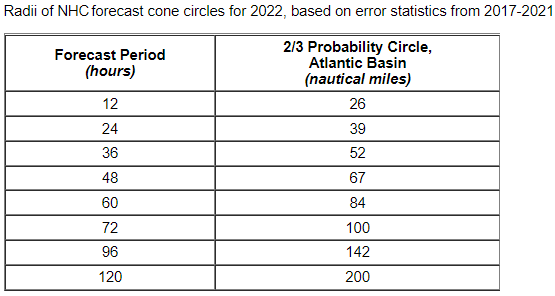
Today, as in 2002, the cone connects a series of circles centered on each forecast point (12-hour, 24-hour, and so forth). The radius of each circle is the distance that two-thirds of NHC track forecast errors at that lead time fell within during the previous five years. These distances are recalculated after each hurricane season, but do not change for individual storms. Easy forecast or hard, the radii are fixed and cannot be altered by NHC forecasters on the fly.
If that is a surprise, you aren’t alone. The tracks of storms straying outside the confines of the cone in around one-third of cases highlights what I think is one of its biggest weaknesses. While it is not the intent of the product, the cone lends itself to interpretation as a bright line between areas inside and outside, when no such delineation exists. This is particularly troubling as the cone has informally started to be interpreted as a risk binary: the dangerous misinterpretation that if I’m not in the cone, I don’t need to worry.
Setting aside the fact that cone does not constrain the position of storm center a full one-third of the time, it also does not communicate any information about the expected surge, rain, or wind hazards of the storm. Since 2011, each NHC cone graphic carries the following disclaimer: “Note: The cone contains the probable path of the storm center but does not show the size of the storm. Hazardous conditions can occur outside of the cone.”

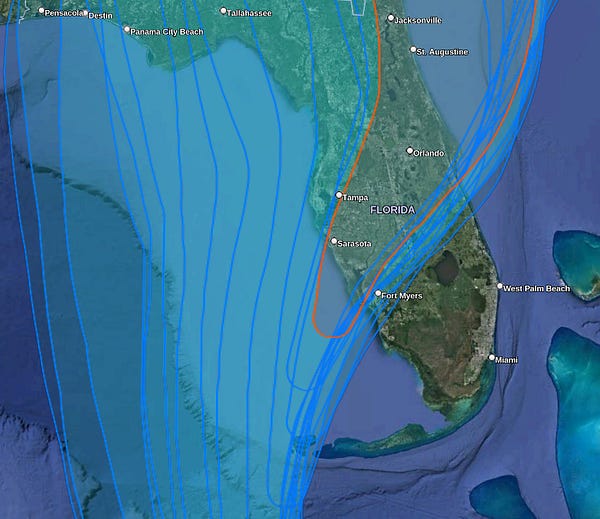
This was certainly the case for Ian. While Ian’s landfall location in Cayo Costa never lay outside the cone, areas from Fort Myers south were not in the cone 72 hours prior to landfall. While NHC key messages and forecast discussions highlighted elevated forecast uncertainty and surge and wind threats to all of Florida’s Gulf Coast in that period, the silent, immutable cone worked against that messaging for some.
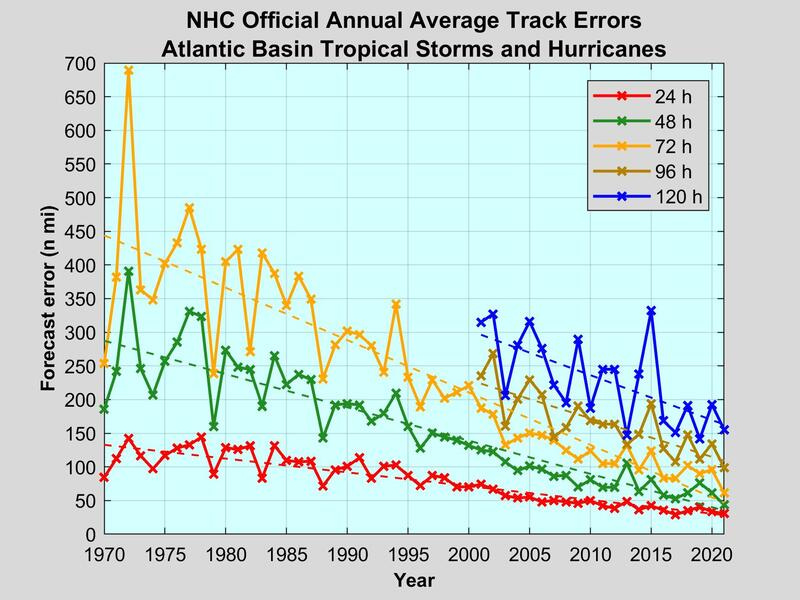
While the cone is made the same way in 2022 as in 2002, the product is quite different in practice for the simple reason that the NHC’s average forecast errors have been cut in half in the last twenty years. This advancement is a testament to the skill and tenacity of NHC forecasts and all who have improved observation and modeling technologies; it also means that the area swept out by the cone has declined by over 75% in that time.
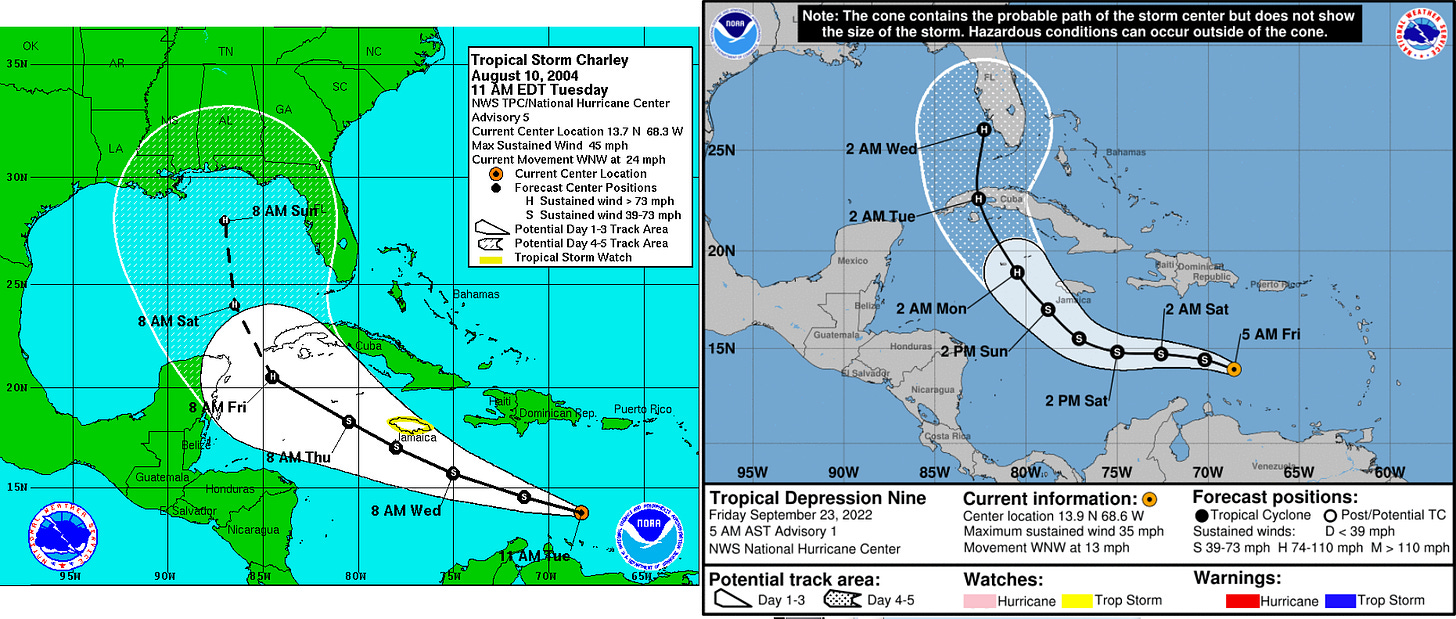
When Charley was developing in the east-central Caribbean in August 2004, an enormous chunk of the continental U.S. stretching from western Louisiana to central Alabama to Southwest Florida and the Keys was within the five-day cone. In contrast, Ian’s cone from a similar initial position intersected just the Florida peninsula. In some ways, the slender, modern cone is the new skinny black line: the older cones were less accurate, but by casting a wide net, covered more areas that eventually saw impacts (and many that did not). This is less true today, making the misconception that the cone is the only region of possible surge, rain, or wind threats increasingly hazardous.
These limitations in mind, the cone may well evolve post-Ian. I’ll be back next week with some thoughts on how NHC forecast graphics might be re-imagined for the next generation of forecasting, and to answer your burning Ian questions. In the meantime, here’s hoping for no more cones in 2022, or at least none intersecting land. Keep watching the skies.


